02 / The read
One sector, two diverging tracks.
PQC compounds; QKD crawls.
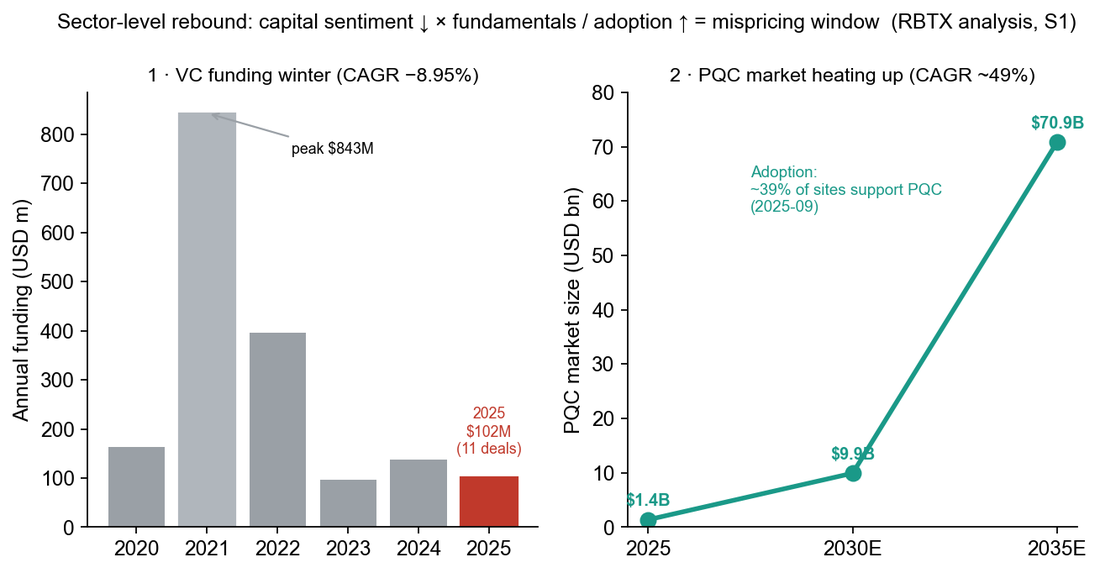
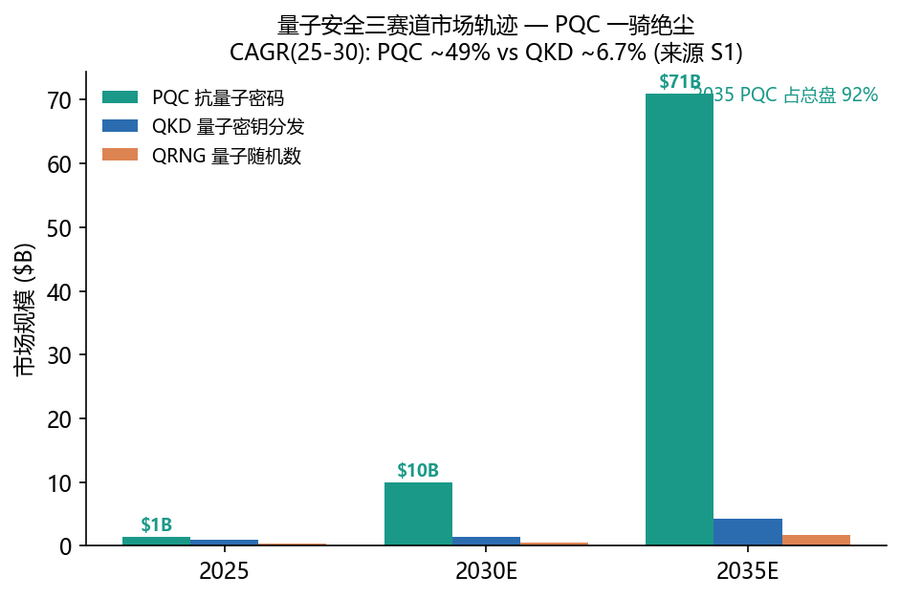
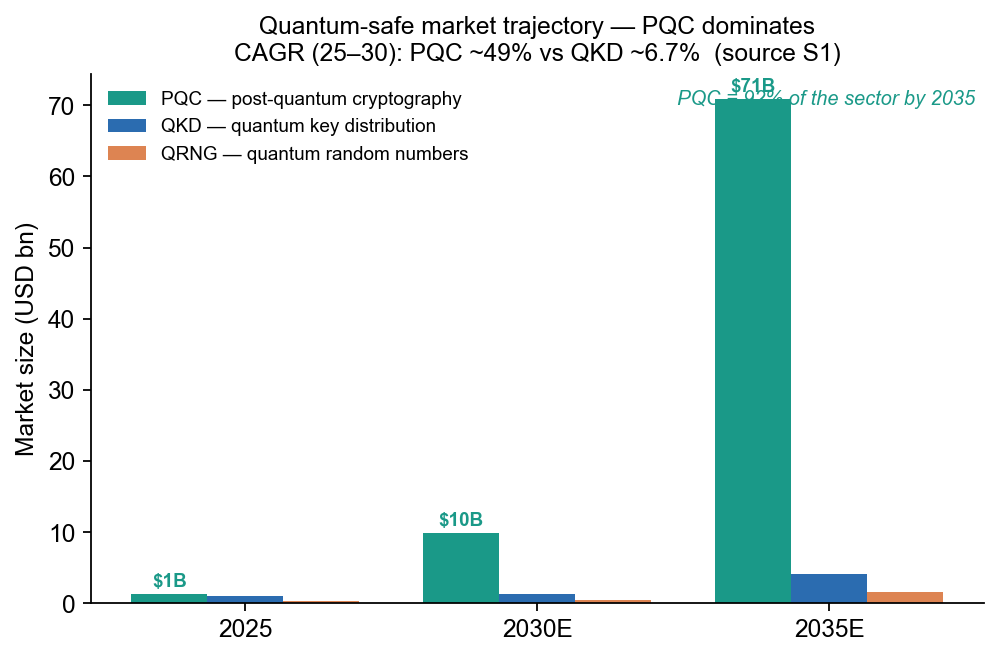
The global quantum-safe market runs from about USD 2.70 bn (2025) to USD 11.8 bn (2030) and on toward USD 76.8 bn (2035). But the sector is not one thing: post-quantum cryptography (PQC) compounds at ~49% a year and takes ~92% of the pie by 2035, while quantum key distribution (QKD) grows at only ~6.7%.
Any “quantum-safe” read that weights QKD and PQC equally is, in our view, an allocation error. The two are a software track and a hardware track on different clocks.
- Finding 01PQC dominates~49% CAGR to 2035, the only quantum-safe segment led by North America (42% share). QKD stays a single-digit-growth niche.
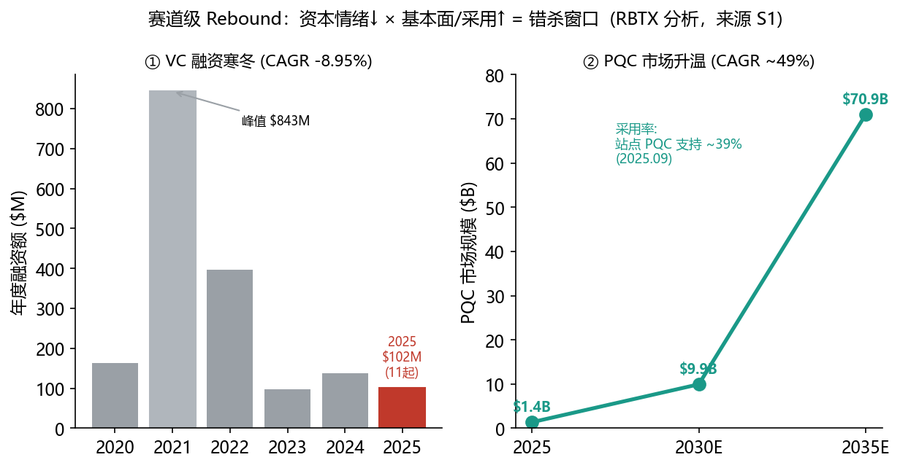
- Finding 02A sector-level mispricingVC funding fell from ~$843M (2021) to ~$102M (2025) while adoption rose — a divergence we read at the industry level.
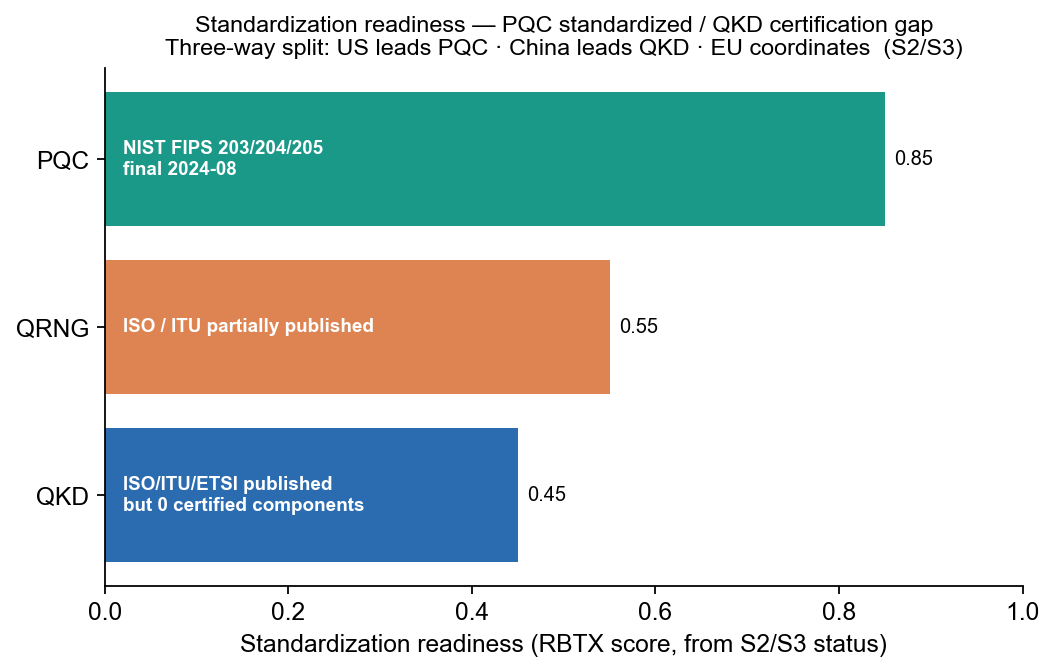
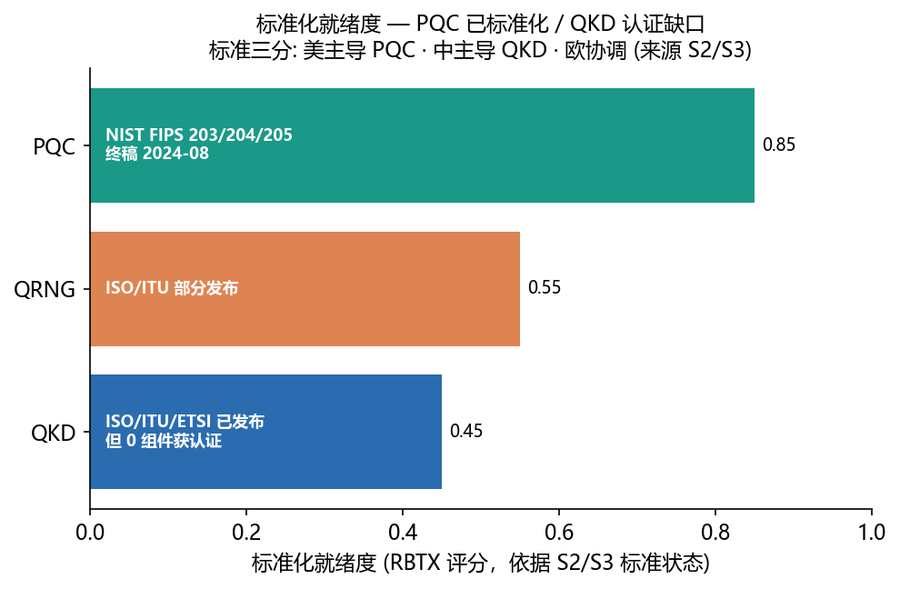
- Finding 03Value is migratingNIST standardization commoditized the algorithms; the next layer of value is migration & crypto-agility, not algorithm IP.
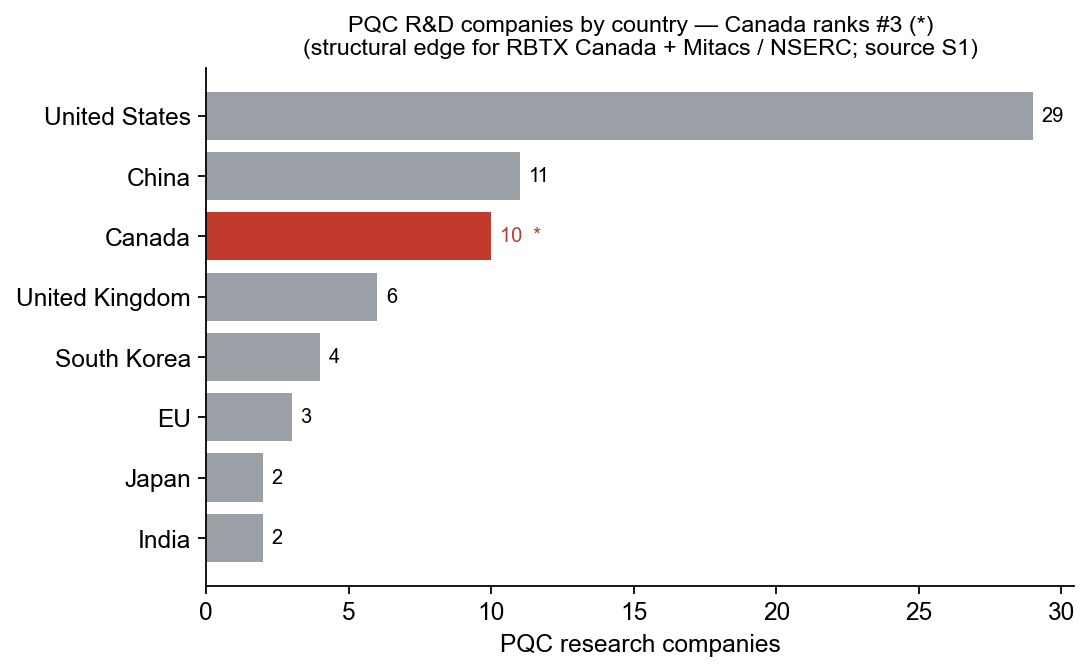
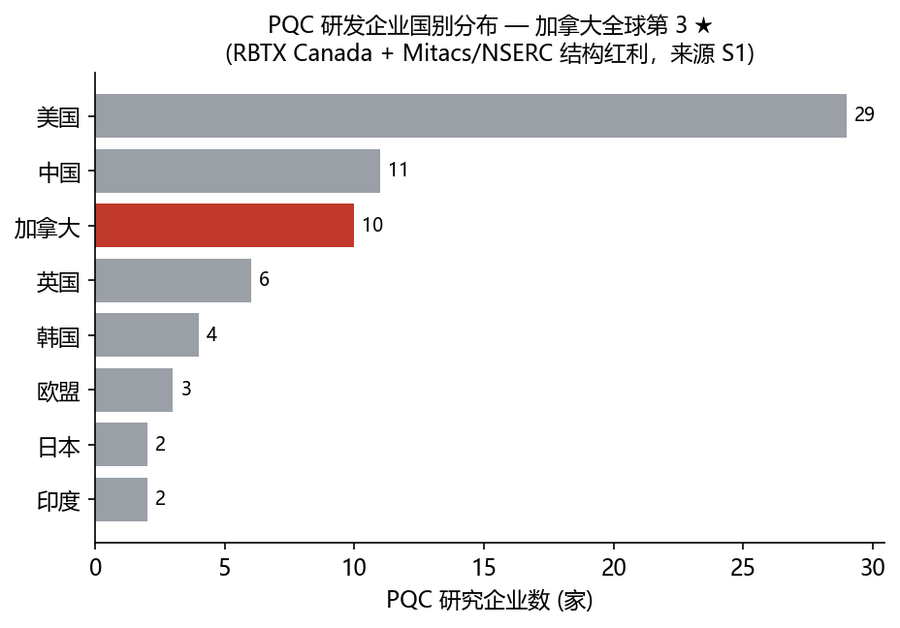
- Finding 04Three-way split + CanadaUS leads PQC, China leads QKD, the EU coordinates — and Canada is #3 in PQC R&D firms, a structural edge for RBTX Canada.